
Objective
Learn how to calculate slope in Google Sheets.
Introduction
The slope of a chart allows you to analyze the steepness of a line. This concept is used to gather information about the trends in the data. Therefore Calculating slope in Google Sheets can be very useful in cases where you want to examine the growth rate of any quantity over a period of time.
Understanding how to calculate slope in Google Sheets can give you an idea of how steeply a metric is growing or falling.
For example, if you are tracking sales data of your business over time, making a slope graph in Google Sheets will help you quickly visualize the sales growth over time.
If you’re still wondering why slope in charts is useful to show, you may want to read how slope charts are useful.

Example Data
The following spreadsheet displays the price of cars from the year 2000-to 2021. I will use this data to demonstrate some examples of how to calculate the slope.

Method 1: Calculating slope using Scatter Charts
Step 1: Select data
First, we select the data for which we want to plot the chart. We will then be calculating the slope in Google Sheets for this plot.

Step 2: Insert chart
- Click on Insert -> Chart.

- Under the Setup section of the Customize tab, select Scatter Chart as the Chart type.

- As shown in the figure below, the following scatter chart is generated.

Step 3: Add Trend line
- Click the Series drop-down section of the Customize tab, and choose the Trend line option.

- After choosing the Trend line option, choose the Use Equation option from the Label drop down.

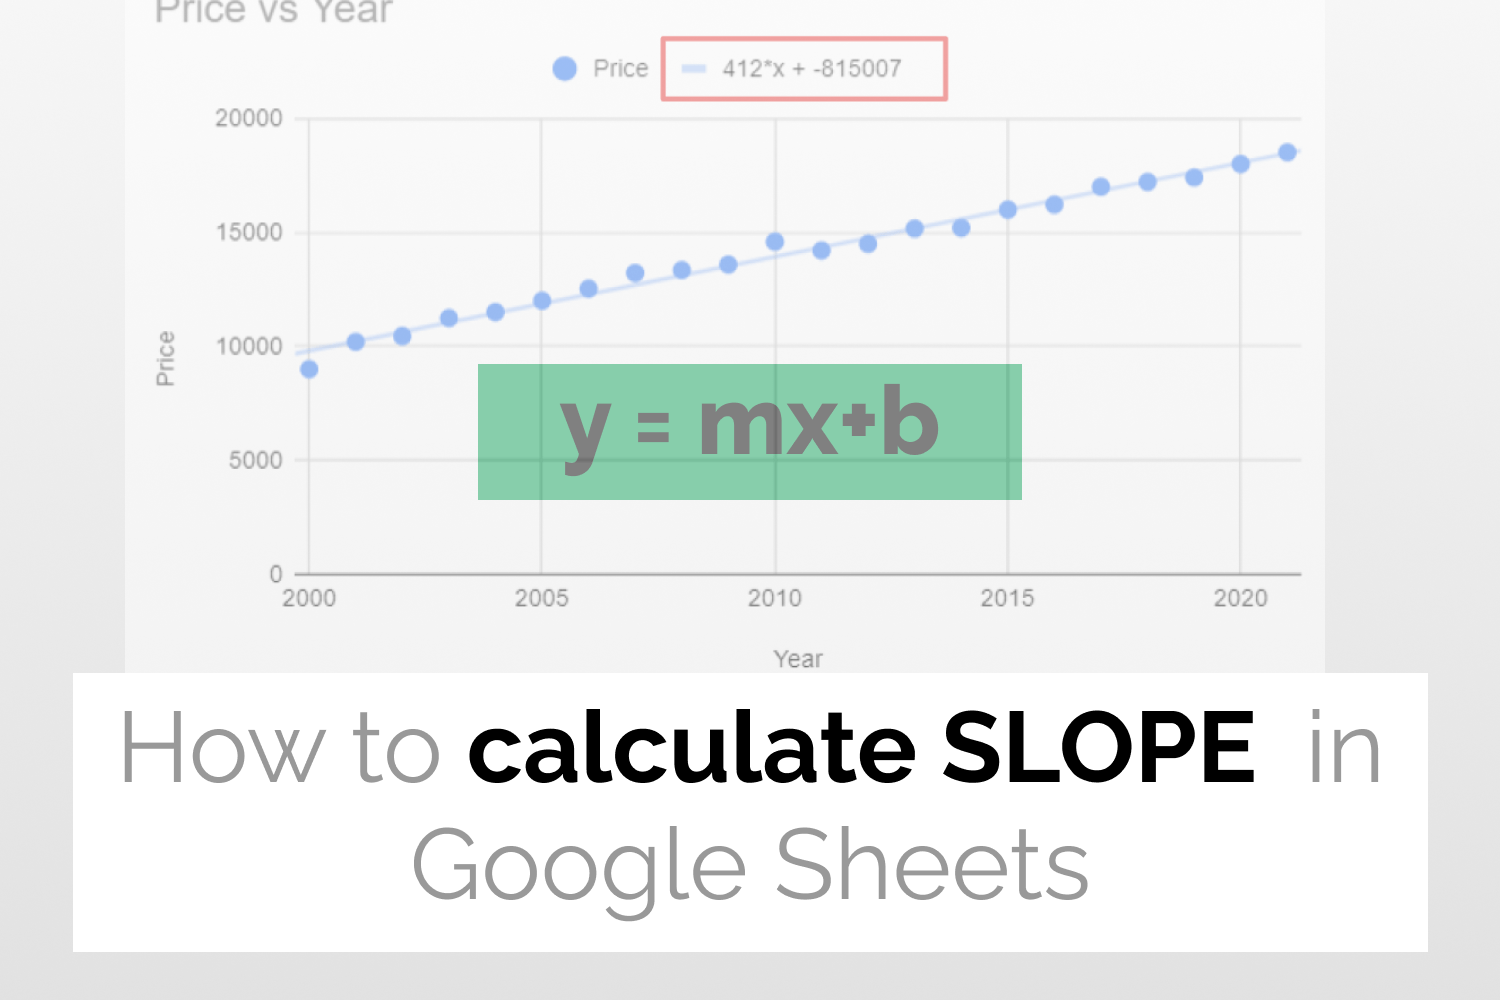
- Now your chart looks like this. As you can see in the figure shown below, the equation of the trendline also gets added to the chart.

Step 4: Calculating slope
The displayed equation of the line is of the form y=mx +c, where in this case m= 412 and c= -815007.
Hence the slope of our line is 412.
Method 2: Calculating slope using SLOPE function
Syntax
SLOPE(data_y, data_x)
- data_y– Refers to the range of cells representing the dependent variable.
- data_x– Refers to the range of cells representing the independent variable.
I will pass the entries in column B and column A as data_y and data_x to the SLOPE Function. The following formula will calculate the required slope.
=SLOPE(B2:B23,A2:A23)

Conclusion
In this example, we covered two ways to find slope in Google Sheets. Want to know learn more formulas and functions in Google Sheets? Look at our definitive guide on Google Sheets which covers hundreds of such topics. Enjoy reading!
See More
How to add a Header and Footer in Google Sheets: