What it does – Calculates the probability of a random variable lying between the mean value and the input parameter
Syntax:=GAUSS(x)
x – How far a random variable is from the mean value
Sample usage:=GAUSS(1)
// The output will be 0.34 as there is 34 percent chance that the random variable lies between mean value and one standard deviation away from it
Sample Google Sheets template with formula here.
Google Sheets can help us accomplish a wide range of tasks. Calculating probabilities of different types of functions is just one of them. We have already covered how to calculate the probabilities under different conditions using BINOMDIST and POISSONDIST functions in Google Sheets. We will learn how to use the GAUSS function in Google Sheets.
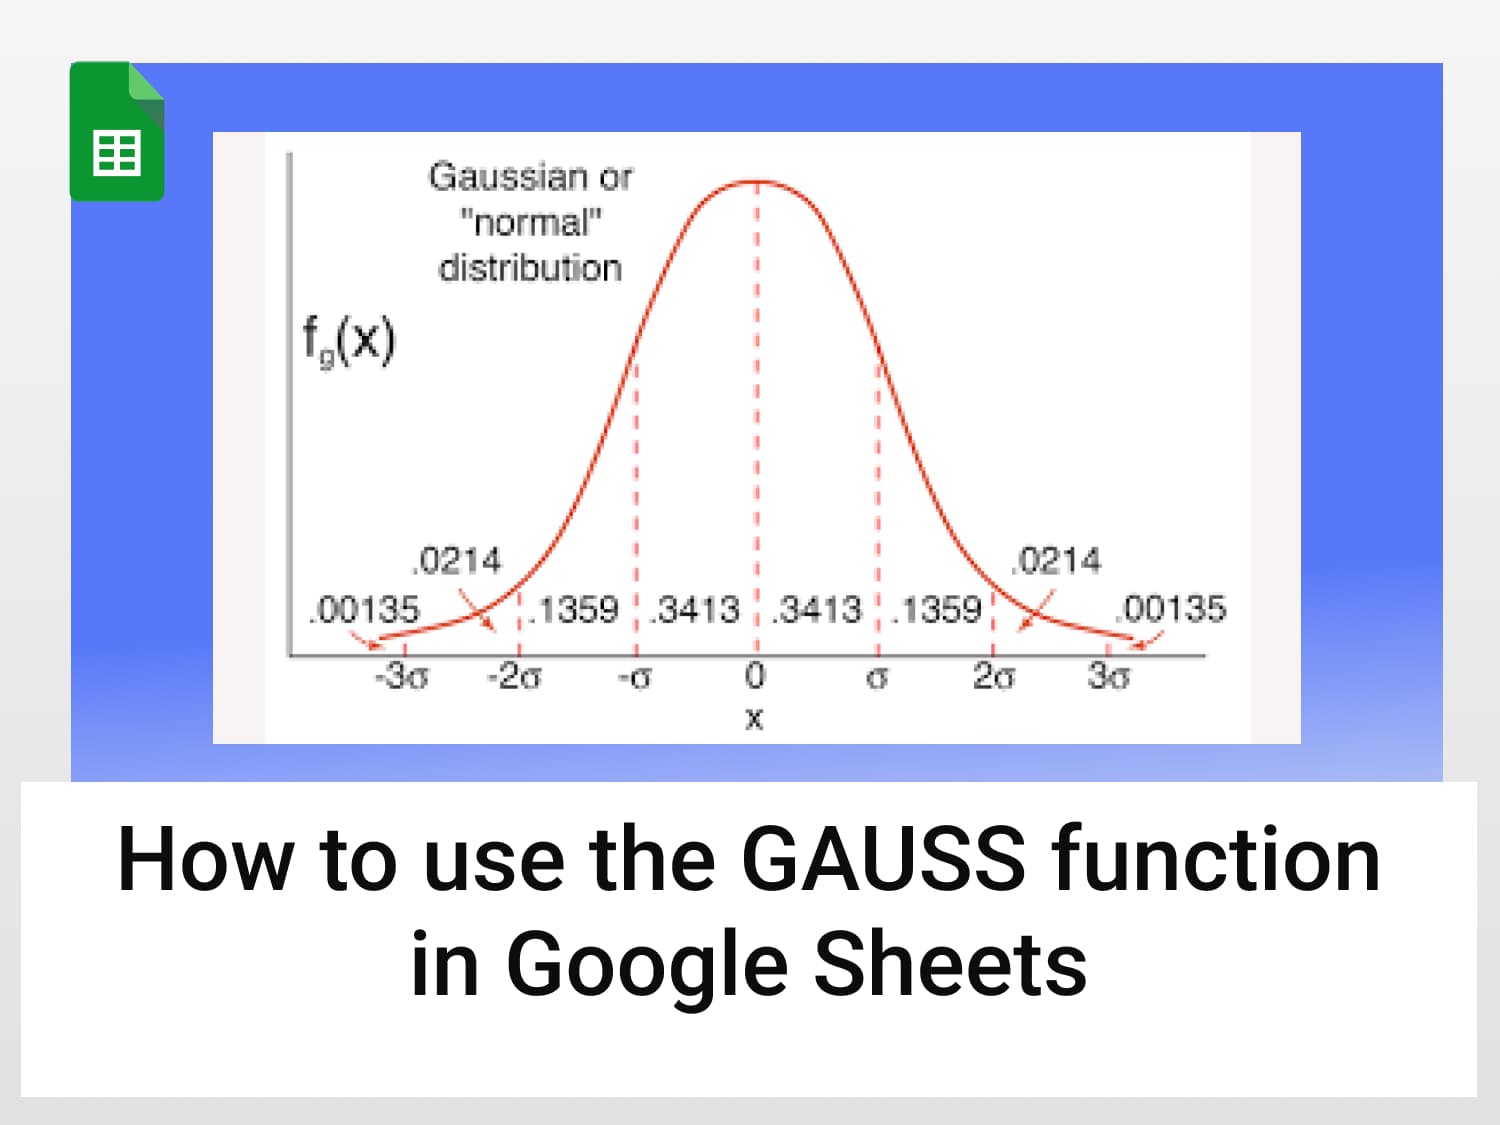
Using Google Sheets’ GAUSS function, you can calculate the probability that a random variable will fall between x standard deviations above or below the mean. In the following image, the probability of a random variable falling in a region is directly proportional to the area under the curve.

In this tutorial, we will learn how to use the GAUSS function in Google Sheets.
Use the GAUSS function in Google Sheets
Standard deviation is calculated as the square root of the variance. In any case, to calculate it, find the mean of the data set, find the difference of each data point to the mean, squaring the difference, adding them together, dividing by the number of data points in the set less 1, and finding the square root of that number.
In the following example, we have a column full of different values of standard deviation. Our objective is to find the Gaussian probability that a random value may fall between the mean and standard deviation value.

The steps are as follows:
- Select the empty cell under the Gauss function header

- Begin your function with the ‘=’ sign. Type in the ‘GAUSS’. The Google Sheets will prompt this function, press the Tab/Enter key to autocomplete. The tooltip guide will appear along with the details.

- Enter the cell address of the standard deviation values as the parameter

- Press the enter key and you will see Gaussian probability as the output

- Drag down the formula to fill in empty column values

The values of Gauss function tells you about the probability of a variable between mean value and Standard deviation * x where x can have any values like 0.25, 0.5, -2 etc.
We have successfully learned how to use the GAUSS function in Google Sheets.
Conclusion
The Gaussian function is used whenever we need to calculate the probability in case of a continuous valued function. We have successfully learned how to use the GAUSS function in Google Sheets. You can now use this function to your advantage.
Commonly asked questions
What is the difference between normal and Gaussian distribution?
Gaussian distribution and the Normal distribution are one and the same
What is the difference between Gaussian and Poisson distribution?
The Poisson distribution takes on values for 0, 1, 2, 3, and so on because of its discrete nature, whereas the Gaussian function is continuously varying over all possible values
How do you know when to use binomial distribution or normal?
The main difference between the binomial and normal distributions is that the binomial distribution is a discrete distribution whereas the normal distribution is a continuous distribution. This means that a binomial random variable can only take integer values such as 1, 2, 3, etc.
See Also
You have learned how to use the GAUSS function in Google Sheets. Are you interested in learning more about how much you can succeed with Google Sheets? With so many powerful features of Google Sheets, you save time and effort.
We have several tutorials that cover tricks and tips in Google Sheets. You can discover them here.
Here are some articles you might be interested in:
https://blog.tryamigo.com/how-to-use-sort-function-in-google-sheets/
https://blog.tryamigo.com/sort-query-using-order-by-in-google-sheets/
https://blog.tryamigo.com/introduction-to-date-function-in-google-sheets/