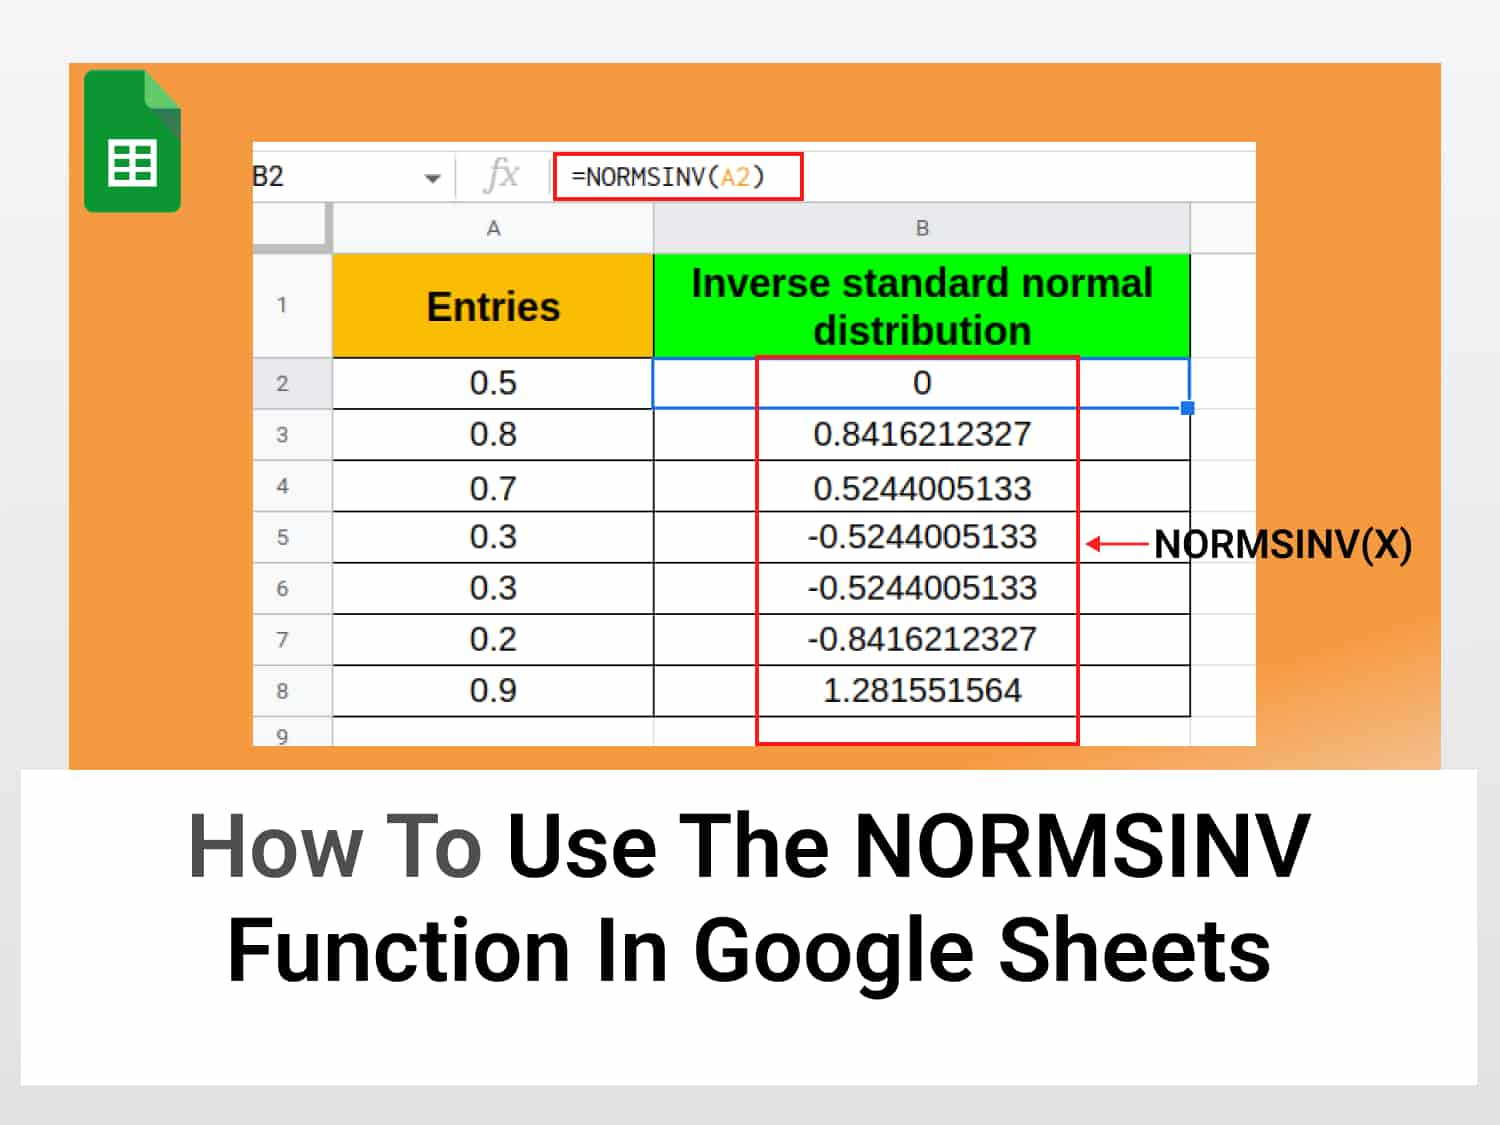
The NORMSINV function in Google Sheets calculates the inverse standard normal distribution for a given probability value.
Syntax=NORMSINV(X)
Where X is the input into the inverse standard normal distribution function.
Note: The value of X must be 0<X< 1. Any entry for the probability value must be greater than zero and less than one. If you supply values that don’t match the range the NORMSINV function will return an error message.
Sample Usage=NORMSINV(A4)
//This returns the value of the inverse standard normal distribution for the probability in cell A4.
- NORMSINV function
- What is a normal distribution?
- What is a standard deviation?
- Using the NORMSINV function
What is the NORMSINV function in Google sheets?
NORMSINV function is a Google Sheets function that calculates the inverse standard normal distribution for a given probability value (usually, this is a value that can be obtained using NORMDIST, another Google Sheets function). This might really sound like a handful, so let’s take a look at some of the basics of normsinv formula.
What is a normal distribution?
If you have ever seen one of those bell-shaped curves trying to map out the distribution of certain population factors e.g height of a given population, then chances are that you were looking at a normal distribution.
The normal distribution is a probability distribution that consists of a symmetrical placement of a data set in which most values tend to cluster in the mean (middle) and the rest of the points taper off symmetrically towards the two extremes.

The normal distribution, among its other uses, is widely used in examining biological factors like the height I mentioned. Let’s reconsider that.
Most people in a given population are of average height. The number of persons taller/shorter than average people are almost equally distributed. With only a little percentage of the people on extreme ends of the curve – very short or very tall.
Another real-world example of the normal distribution is the intelligence of a population, the majority of people tend to possess around average intelligence and a few are on the other ends of the curve- the extreme cases of genius and well, the not so bright.
There are two essential factors in a normal distribution :
- Mean
- Standard deviation
Mean refers to the average value. In our height example, it is the average height of people in that population; for the intelligence one, it is the average intelligence of the total population. The probability of falling towards the mean is higher than at the edges.
What is a standard deviation?
Standard deviation is simply a measure of how our values are spread out about the mean of the given statistical distribution i.e the edge of our curve.
Now that we know the nitty gritty. Let’s circle back to the topic.
The standard normal distribution is simply a normal distribution that has been “standardized,” this means the mean is zero and the standard deviation is less than 1.
Therefore, the inverse standard normal distribution is a reversal of the process, we are trying to determine the critical value of the distribution when the probability value is already given.
Google Sheets provides a simple function to enable us to do that. The rest of this article will show you how.
How to use the NORMSINV function in Google Sheets
We are going to find the inverse standard normal distribution for a given set of numbers which we will assume are probability values of a standard normal distribution. We will do this in two steps.
You can copy the spreadsheet for this tutorial here.
NORMSINV function in Google Sheets using probability values
Step 1: Setup the data in Google Sheets
We will be obtaining the values for 5 entries, these values which must be within the range of 0 – 1 represent probability values. Input the values into Sheets.

Step 2: Apply the NORMSINV function in Google Sheets
- Select cell B4 and type in the formula for calculating the inverse standard normal distribution. Begin to type =NORM Google sheets will auto-suggest the formula, and select the NORMSINV formula from the dialogue.
- Alternatively, click on formulas ➡ all formulas ➡ Inverse standard normal deviation.

For the probability value, X, we will select the value in cells A4:A10 for the corresponding cells in B4:B10.

The NORMSINV function returns a value in the second cell representing the inverse standard deviation of the given number. Notice that Google Sheets immediately auto-suggests calculated values for the remaining cells in the corresponding column. Accept to autofill them. And that’s it.

Conclusion
The NORMSINV function in Google Sheets, when given an input, easily determines the inverse standard normal distribution associated with that particular probability value.
FAQs
Is the inverse normal distribution the same as the inverse Gaussian distribution?
The inverse normal distribution is different from the inverse Gaussian distribution. While the normal distribution is the same as a Gaussian distribution and both are dependent on standard deviation and mean, the inverse Gaussian distribution is a continuous distribution. NORMSINV in Google Sheets is used for inverse standard normal distribution calculations.
What is the difference between NORMSINV and NORMINV functions?
NORMSINV calculates the inverse standard normal distribution for a value while the NORMINV function calculates the inverse normal distribution for a value, standard deviation, and mean.
See also
https://blog.tryamigo.com/normal-distribution-curve-in-google-sheets/
https://blog.tryamigo.com/using-binomdist-function-in-google-sheets/