Syntax:=POISSON.DIST(x, mean, cumulative)x: To find the likelihood of an event to occur ‘x’ number of timesMean: How frequently an event occurs on average for a given periodCumulative: It’s used if we wish to calculate the likelihood of an event to occur ‘x’ or fewer times. If we wish to calculate only for cases where an event was to occur exactly ‘x’ times then we don’t use cumulative in that case.
Sample usage:=POISSON.DIST(5, 7, TRUE)
//Calculates the cumulative probability of an event occurring 5 or fewer times where the mean of occurrence is 7 times=POISSON.DIST(5, 7, FALSE)
//Calculates the non-cumulative probability of an event occurring exactly 5 times where the mean of occurrence is 7 times
Sample Google Sheets template with formula here.
There may be instances when one wishes to calculate the likelihood of occurrence of an event (specified number of times) over a while. In such scenarios, the POISSON.DIST function in Google Sheets can come in handy.
Applications of Poisson distribution
The Poisson Distribution function is widely used in sales, finance, medical, and many more. Let’s understand the utility of POISSON distribution using the following cases:
- A call center receives 100 calls per hour on average. What is the likelihood of receiving 150 calls in an hour?
- A restaurant receives 500 orders a day on average. What is the likelihood that it gets 100 orders a day?
- It rains 15cm on average during the rainy season. What is the likelihood that it rains 25cm in a day?
All of the questions above have one thing in common. They are focused on calculating the likelihood of any unforeseen events. The POISSON.DIST function in Google Sheets allows you to easily calculate the likelihood of unforeseen events.
POISSON distribution function comes into play when one is well aware of how frequently an event occurs on average (mean) and to calculate the probability of its occurrence if it were to occur ‘x’ times.
Let’s decode the anatomy of the POISSON distribution function and learn how to implement it for different possible scenarios.
Understanding the POISSON.DIST function in Google Sheets
The POISSON distribution function helps us calculate two types of probabilities. They are as follows:
- One is to calculate the likelihood of occurrence of an event an exact ‘x’ number of times.
- Another one is to calculate the likelihood of occurrence of an event ‘x’ or fewer times.
Let’s look at an example of POISSON.DIST function in Google Sheets.
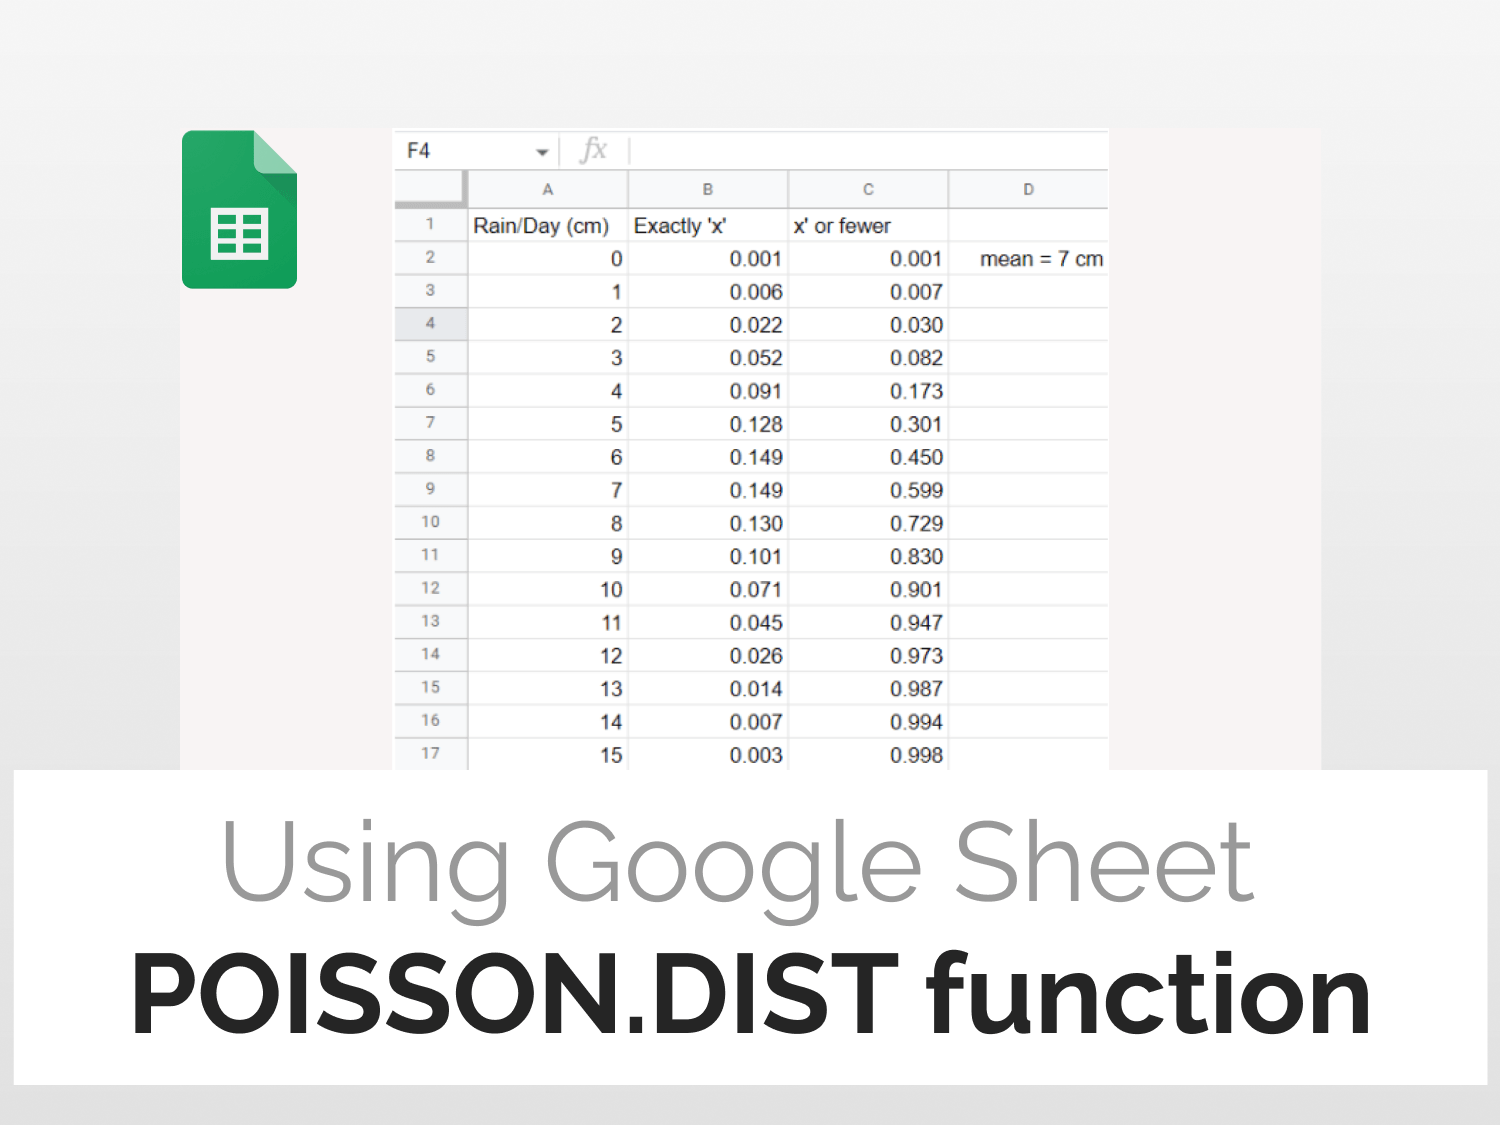
In the example given below, we have a spreadsheet consisting of the amount of rainfall (cm) per day that is well represented by Column A. Column B and column C represent the output of POISSON.DIST function for non-cumulative and cumulative parameters.

Column B deals with finding the probability of receiving exactly ‘x’ cm of rainfall in a day. That’s why it’s called non-cumulative.
=POISSON.DIST(A2, 7, FALSE)
#FALSE value for non-cumulative probability
Column C deals with finding the probability of receiving ‘x’ or less cm of rainfall in a day. That’s why it’s called cumulative.
=POISSON.DIST(A2, 7, TRUE)
#TRUE value for cumulative probability
How to implement POISSON.DIST function in Google Sheets
In this tutorial, we will start with the step-by-step implementation of POISSON.DIST function in Google Sheets.
The steps are as follows:
- Select the cell where you want to hold the result of POISSON.DIST function

- Begin your function with the ‘=’ sign. Type ‘POISSON.DIST’. The google sheets will prompt this function, press enter key to autocomplete. The tooltip guide will appear along with the details.

- Fill in the value of the ‘x’ argument. In this case, A2 is our ‘x’ argument.

- Fill in the value of the mean for the next argument. In this case, we are taking the mean as 7 (It means average rainfall is 7cm).

- In column B, we are calculating only for exact values of ‘x’. Therefore, we will fill the next argument as false.

- Hit the Enter key and drag down the formula to fill the rest of the column.

- All the parameters will be the same for Column C except the Cumulative parameter. In this case, it will be True.

- Similarly, drag the formula to fill column C with their respective values. You will end up with the following table.

Conclusion
We have learned how to use the POISSON.DIST function in Google Sheets using illustrative example. POISSON.DIST function is widely being used in multiple domains where one needs to be prepared for unforeseen events. Now you are all set to start using this powerful statistical tool to your advantage.
The inbuilt POISSON.DIST function in Google Sheets makes calculating probabilities a cakewalk.
Frequently asked questions
What is the difference between binomial and Poisson distribution?
Binomial distribution describes the distribution of binary data from a finite sample. Thus it gives the probability of getting r events out of n trials. Poisson distribution describes the distribution of binary data from an infinite sample. Thus it gives the probability of getting r events in a population.
How do I know if my data is Poisson distributed?
A variable follows a Poisson distribution when the following conditions are true: Data are counts of events. All events are independent. The average rate of occurrence does not change during the period of interest.
What are the limitations of Poisson distribution?
The Poisson distribution is a limiting case of the binomial distribution that arises when the number of trials n increases indefinitely whilst the product μ = np, which is the expected value of the number of successes from the trials, remains constant.
See Also
Are you interested in learning more about how much you can succeed with Google Sheets? With so many powerful features of Google Sheets, you can save time and effort.
We have several tutorials that cover tricks and tips in Google Sheets. You can discover them here.
Here are some articles you might be interested in:
https://blog.tryamigo.com/using-binomdist-function-in-google-sheets/
https://blog.tryamigo.com/generate-a-random-number-in-google-sheets/
https://blog.tryamigo.com/count-unique-values-in-google-sheets/