The STDEV function is used to calculate the standard deviation.
Syntax=STDEV(value1, [value2, ...])value1 – The first value or range of the sample.value2, ...– [ OPTIONAL ] Additional values or ranges to include in the sample.
Sample Usage=STDEV(123,143,155,132,166)//Gives the standard deviation of the values, which is 17.25398505.=STDEV(B2:B6)
//Returns the stand deviation of the values in the range B2:B6.

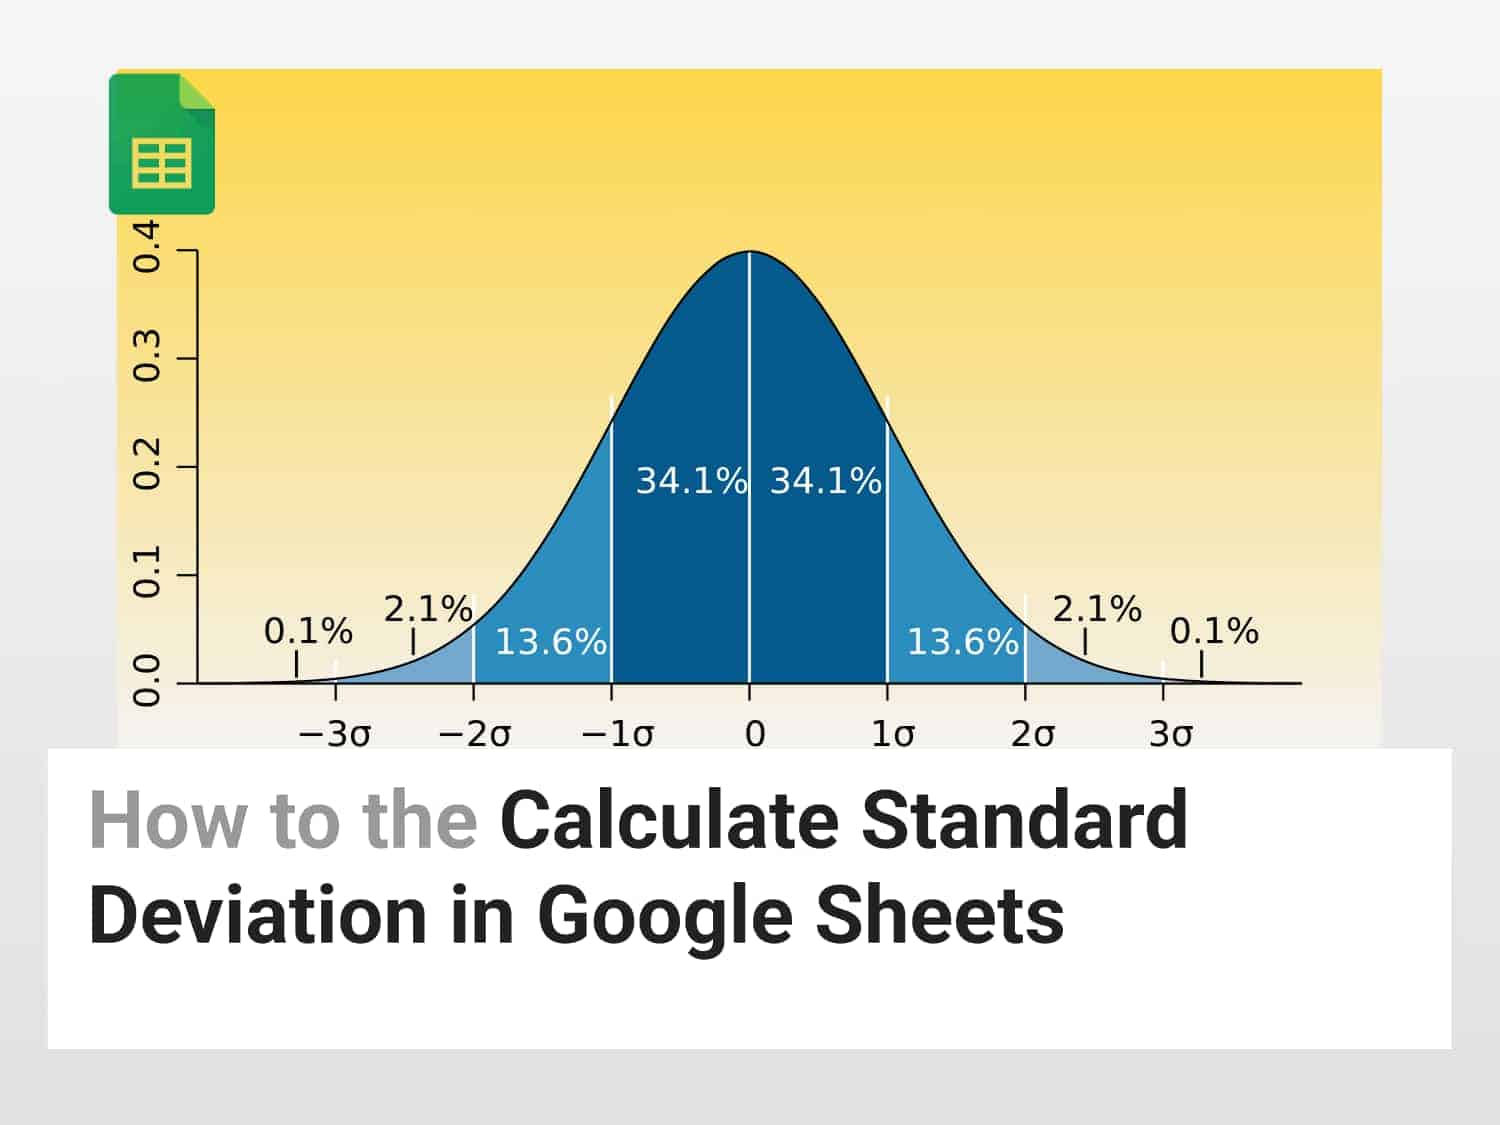
What is Standard Deviation in Google Sheets?
The Standard Deviation of a dataset tells you how much data is deviated from the Mean or Average value of that data. The Standard Deviation in Google Sheets tells how far the data is from the average value of the sample.
For example, you have data from a survey of the population in New York City. The average population is 9 million with a standard deviation of 0.2 million people. What this means is that on average, about 9 million people are living in the city of New York, and at any given point in time, the population is in the +/- 0.2 million range of the average population, i.e. between 8.8 to 9.2 million.
If you want to know more about standard deviation in detail, you can go here.
Why calculate Standard Deviation in Google Sheets?
As discussed earlier, standard deviation helps one measure how much individual points deviate from the mean of the sample. Therefore, standard deviation finds its applications in tracking stock market volatility, measuring the risk of any particular stock or portfolio, and helping calculate margins of error in customer satisfaction surveys.
The STDEV function in Google Sheets calculates the standard deviation based on the given sample.
Important Points to Keep in Mind Before using STDEV to find Standard Deviation in Google Sheets
- Only use Number values to use the STDEV formula. If you use the STDEV formula to find the standard deviation of text values, it will show #DIV/0! Error.
- However, if you have selected a range of cells, and some cells contain text while others contain numbers then cells containing text will be ignored while calculating standard deviation in Google Sheets.
- Let’s say you have a dataset that looks like this:

- Here, you can see that there are text and string characters such as “Amigo”, “@34” and “tr”. These cells will be ignored while calculating standard deviation in Google Sheets.
- If you apply the formula to the entire range, the standard deviation comes out to be 6.188595964.
- Also, If the total number of values supplied as value arguments is not at least two, STDEV will return the #DIV/0! error.
Calculating Standard Deviation in Google Sheets for a Cell Range
- Let’s say you have a range of cells displaying petrol prices for every month.
- You want to calculate the standard deviation of the petrol prices from the average petrol price for the first 5 months.
- To fulfill this task, use the following formula:
=STDEV(B2:B6)
- The output of the formula is shown below:

- The standard deviation is coming out to be 0.209117192. This means that the petrol prices are varying from their mean by 0.209117192.
Calculating Standard Deviation in Google Sheets for a Range of Values
- Rather than specifying a cell range, you can manually input the comma-separated values to find the standard deviation.
- Let’s say you want to find the standard deviation of the heights of students. You can manually input the data in the formula, like:
=STDEV(123,143,155,132,166)
- The formula will take all the values as input to find the standard deviation.
- The standard deviation comes out to be 17.25398505.
Conclusion
The STDEV formula is used to find the standard deviation of numbers or a range of values. If you input data in other formats such as text or symbols, it will show either show errors or skip them during calculation. Go through the official documentation to know more about the STDEV function.
See Also
Want to know more formulas and functions in Google Sheets? Look at our definitive guide on Google Sheets which covers hundreds of such topics. Enjoy reading!
Filter Data by Color in Google Sheets: In this article, we would have a look at how to Filter Data by Color in Google Sheets.
How to group rows in Google Sheets: We will learn how to group rows in Google Sheets. We will also have a look at nested grouping.
Complete Guide on the REGEXEXTRACT Function in Google Sheets for 2022: Learn how to use the REGEXEXTRACT function in Google Sheets and its variations.
How to View Edit History of Cells in Google Sheets | Easy 2-Minute Guide: Learn how to view the edit history of cells in Google Sheets. Learn to spot mistakes or past changes.