
Generic formula
=GOOGLEFINANCE(ticker, [attribute], [start_date], [end_date|num_days], [interval])

To return the real-time stock price of, eg, Tesla
=GOOGLEFINANCE(NASDAQ:TSLA)

To return 30-day historical data with 7 days interval
=GOOGLEFINANCE(NASDAQ:TSLA, 1/1/2022, 30, 7)

Convert USD to INR
=GOOGLEFINANCE("CURRENCY:"&""USD"&"INR")
Learn how to track Stocks using Google Finance in Google Sheets and examples of its usage. We will also see some other functionalities possible through the same function.
- How Google Finance Works
- Syntax
- Get real-time stock prices
- Historical price data
- Mutual fund information
- Currency conversion
How Google Finance Works
Google Finance is a website with a focus on business news and financial information hosted by Google.
The GOOGLEFINANCE function in google sheets helps you fetch real-time financial data along with historical securities data from Google Finance. Google Finance is a web service by Google, focused on business news and financial information.
If you want to gather data about any stock, usually you would’ve gone to another website to copy and then paste it back to your sheet. Or you could have used some third-party service to achieve the same. These methods are cumbersome, unreliable, and don’t give you real-time information.
You can instead use the GOOGLEFINANCE function inbuilt.
Google Finance: Syntax
=GOOGLEFINANCE(ticker, [attribute], [start_date], [end_date|num_days], [interval])- GOOGLEFINANCE: function name, fetches current or historical security information
- ticker: ticker symbol of security, mandatory to use both exchange symbol and ticker symbol to avoid discrepancies. For Eg. use “NSE:TCS”.
- attribute: optional parameter(‘set to ‘price’ by default’), type of information GOOGLEFINANCE should fetch. There are a number of options available check them at (insert doc link here).
- start_date: optional parameter, enter the start date of the search whilst searching for historical data
- end_date|num_days: optional parameter, end_date for the end date of the historical data search, num_days for the number of days from the start day you want to calculate. If you leave this field blank but fill the start date then it will return the data for the start date.
- interval: specifies the frequency of the output data, two possible values “weekly” and “daily” ( or ‘7’ and 1 respectively)
Real-Time Data Stock Price
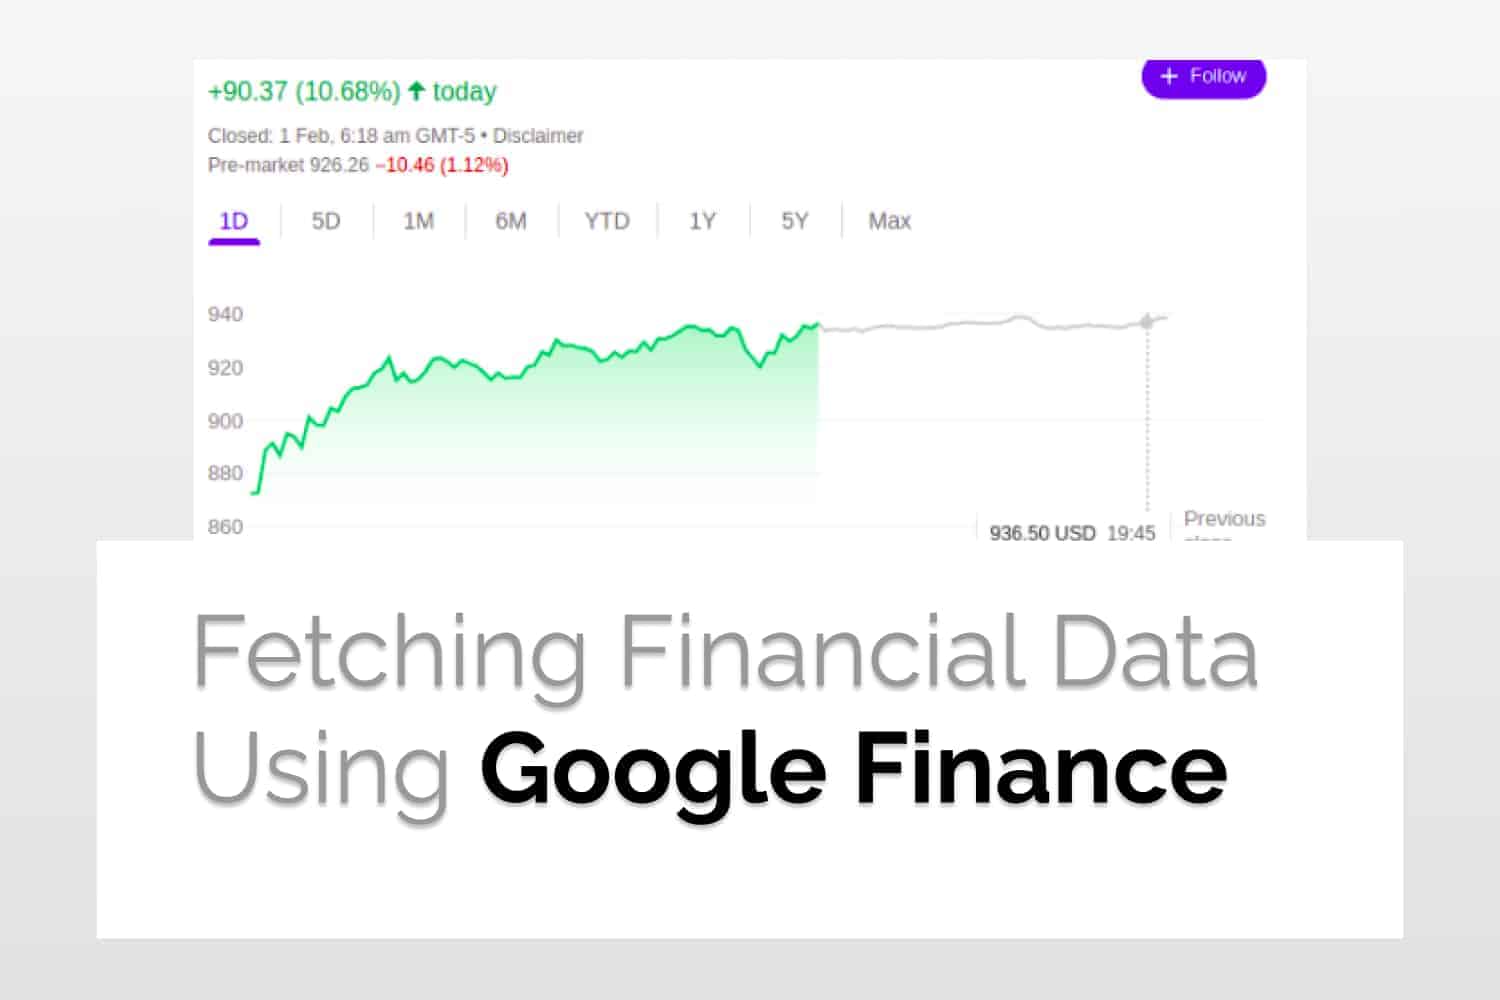
Let’s first see how to track stocks using Google Finance. For example here, I have used Tesla(NASDAQ: TSLA) to experiment with this function.
Just a quick Google search for the same gives me the result shown below.

To return the current price for the stock for this example, use the following formula:
=GOOGLEFINANCE(NASDAQ:TSLA)
This is in line with the data mentioned above. Some of the other basic attributes used are listed below.

Rather than typing “NASDAQ:TSLA” again and again I have just referenced the cell’s value from cell B1, and referenced attributes value from the first column.
Historical Data Price
The function also provides the historical data based on the start_date and the num_days/end_date given. The attributes that can be used are as follows.
- open: Opening price for the specified date(s)
- close: Closing price for the specified date(s)
- high: High price for the specified date(s)
- low: Low price for the specified date(s)
- volume: Volume traded for the specified date(s)
- all: all of the above
To get Tesla’s historical price data for 30 days from January 1, 2022 with seven days interval, we’d use the following formula:
=GOOGLEFINANCE($B$1, $B$2, $B$3, $B$4, $B$5)We use the dollar sign to make the cell reference absolute so that the values do not change when the formula is copied.
A sample use for the same is given below.
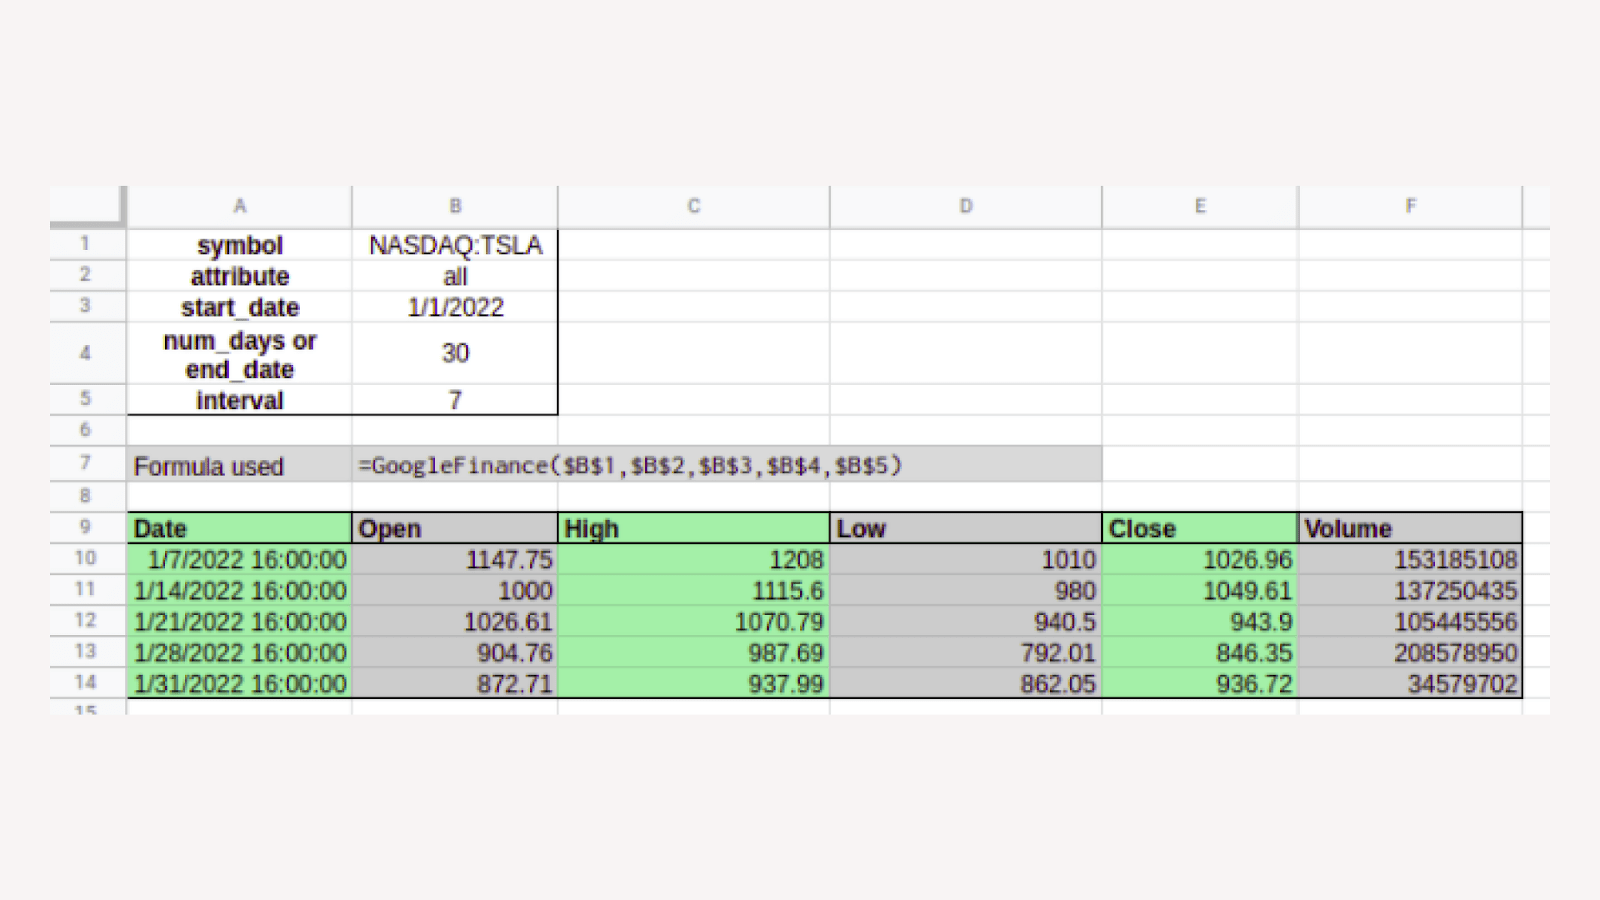
There is a possibility that you might see an error like “#REF!”. This happens when you have not left enough space for the data to fill in and it is clashing with some other data in another cell.
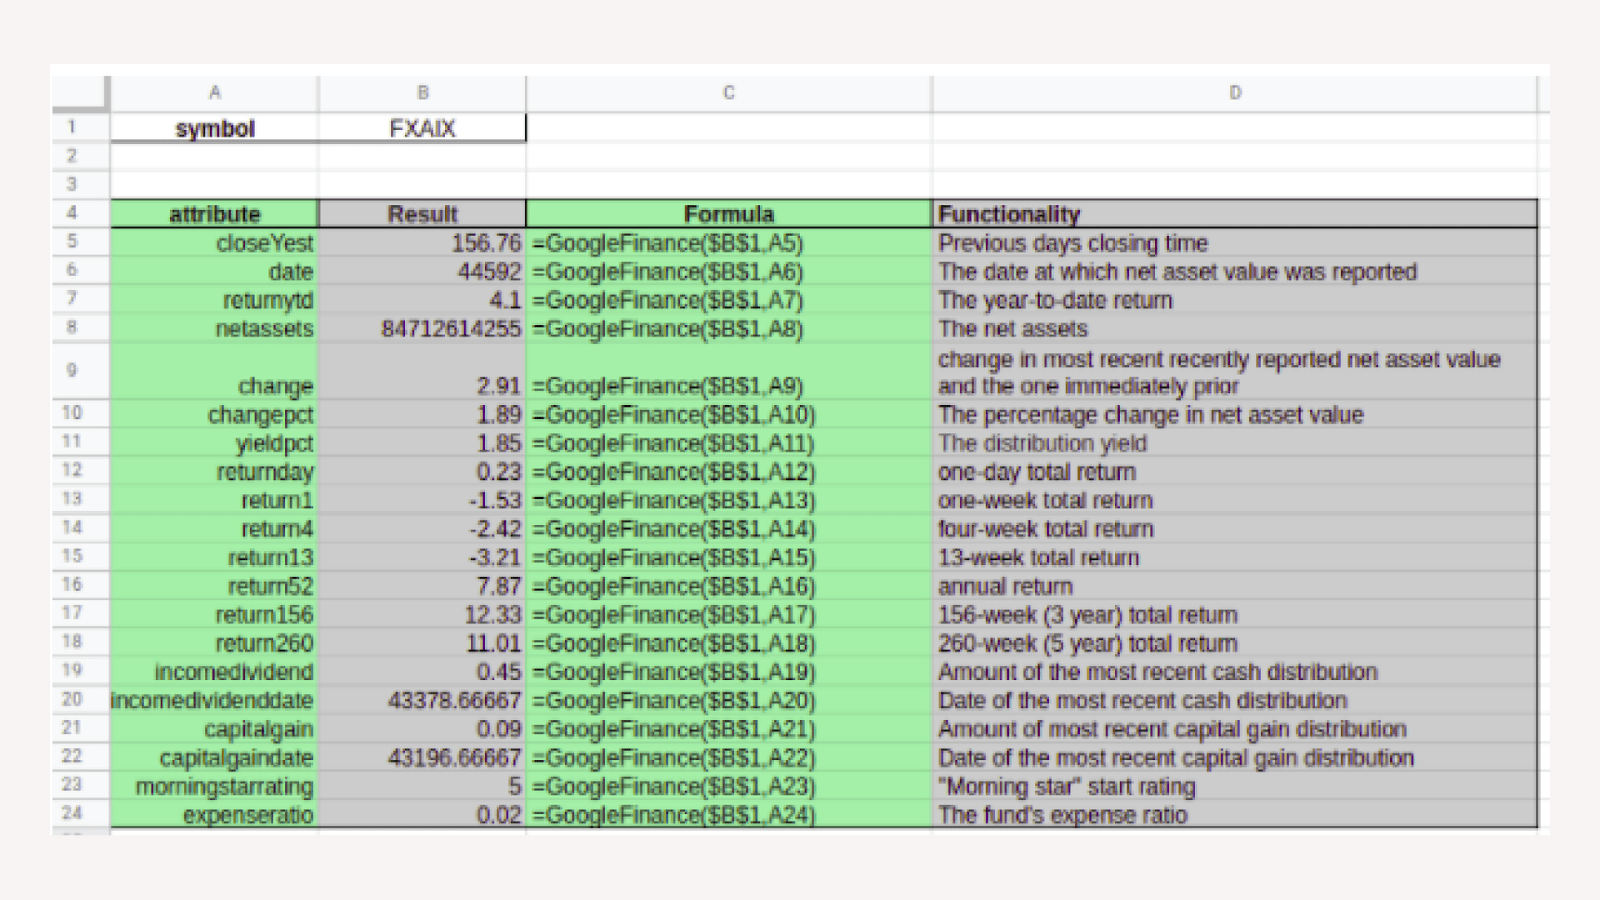
Mutual fund data
It is as easy as calculating the data for different stocks. Also, it comes with a different set of attributes that are relevant for the same.
Currency Conversion
You can also use this function to convert currency on a real-time basis using the following syntax.
=GOOGLEFINANCE(“CURRENCY:”&”curr1”&”curr2”)To convert, for example, US dollar to Indian rupee using, we’d use the following formula:
=GOOGLEFINANCE("CURRENCY:"&""USD"&"INR")
We can also create a table for the currency exchanges over a period of time using the TODAY function.

Conclusion
If you’re a trader or work closely with money this way is far more efficient and better than conventionally copy-pasting all the securities information. Hope this article was helpful!
See Also
Here are some related articles that you may find useful.
https://blog.tryamigo.com/import-yahoo-finance-data-into-google-sheets/
https://blog.tryamigo.com/import-data-from-nasdaq-to-google-sheets/
https://blog.tryamigo.com/how-to-calculate-cagr-in-google-sheets/
https://blog.tryamigo.com/import-coinbase-data-to-google-sheets/