CAGR can be calculated using the RRI function.
Syntax=RRI(number_of_periods, starting_value, ending_value)number_of_periods – The number of periods in years. If the period is 26 months, enter (26/12).starting_value – The value of the initial investment.ending_value – The final value after interest.
Sample Usage=RRI(7, 8000, 20000)
//Returns the CAGR, which is 0.139852281.
What is CAGR?
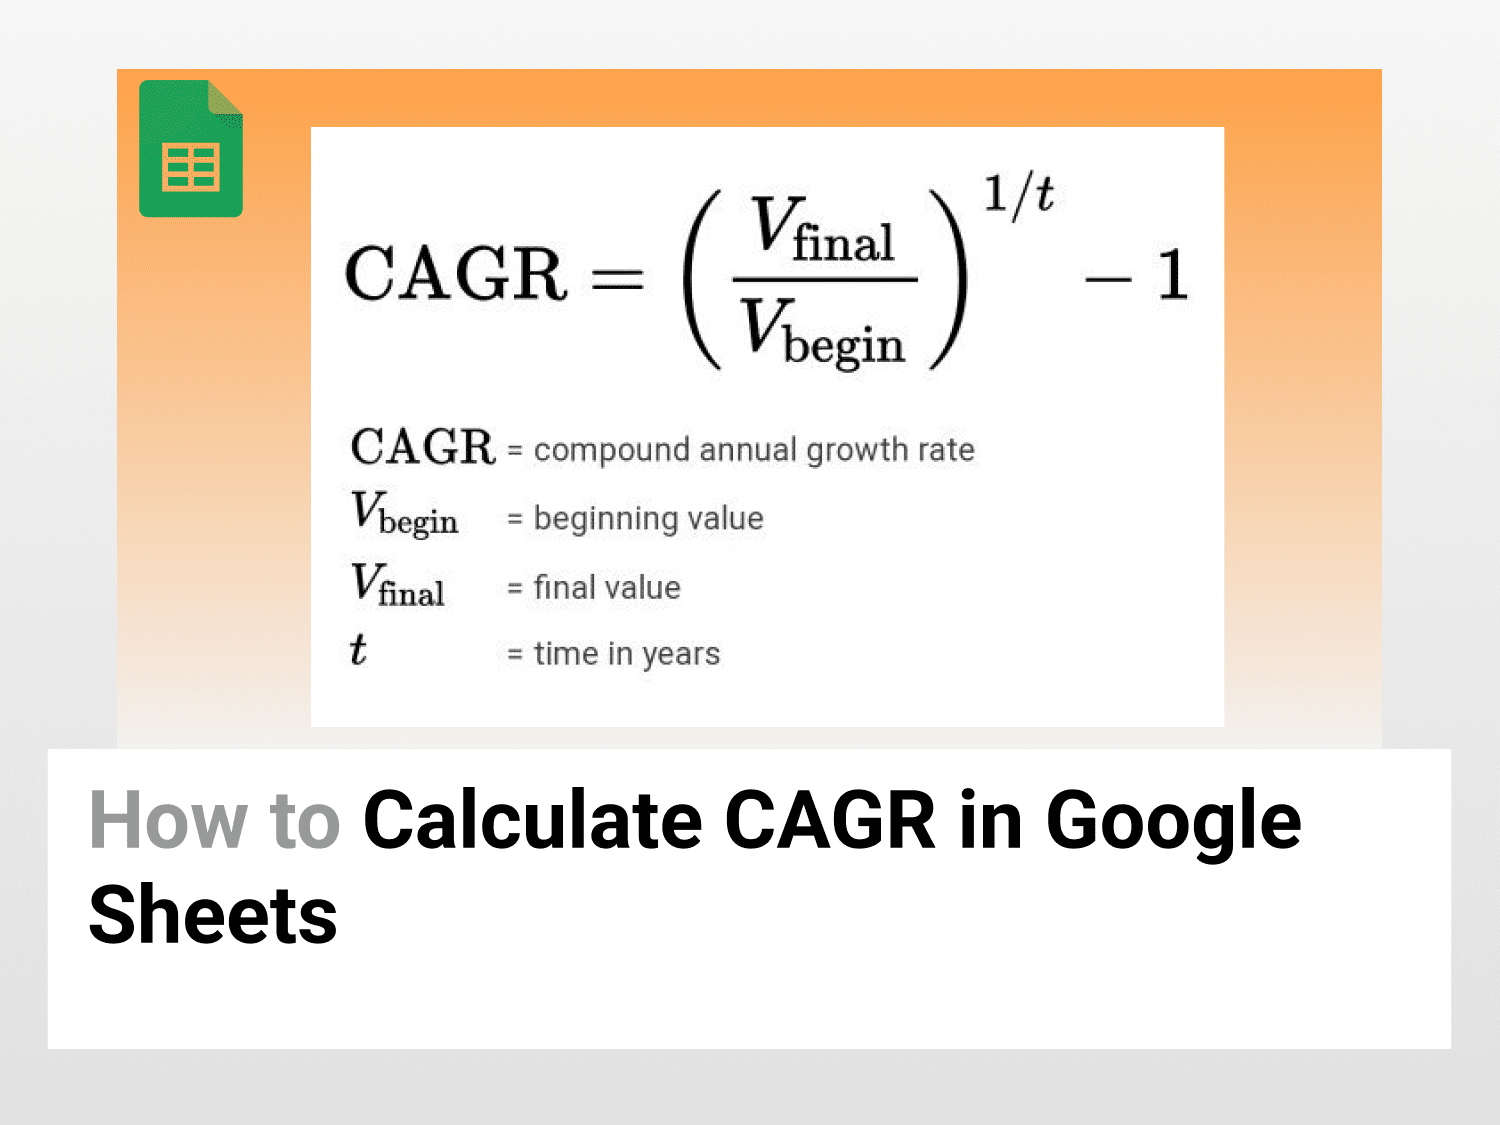
The compound annual growth rate (CAGR) is the rate of return (RoR) required for any investment to grow from its initial balance to its closing balance, assuming that profits are reinvested at the end of each period of the investment’s life span.
Let’s say you invest $100 in a systematic investment plan. You get an interest rate of 5% p.a. So, after a year, your investment value is $105. Now, you reinvest $105 instead of withdrawing the profits. The rate of return is 5%p.a. So after another year, the investment will be 110.25. To hear, you can see that you earned higher returns by investing the profits. Here, the CAGR is 5%.
Why use CAGR in Google Sheets?
CAGR is a formula used for comparing the performance of various investments over time. The CAGR contributes to overcoming the limitations of the arithmetic average return. Investors can use the CAGR in Google Sheets to determine how well a stock performed compared to other stocks in a peer group or against a market index. The CAGR can also be used to compare the historical returns of stocks to those of bonds or savings accounts.
How to calculate the CAGR in Google Sheets?
Formula

Here,
- Final Value: The final amount you will receive after maturation, considering you have reinvested your profits.
- Initial investment: The amount of money you invested.
- Years: Number of years after which initial investment will yield to Final Value. If you have invested for six months, keep years=0.5. It is essential to convert the duration to years.
Make a Copy of the Spreadsheet
Step 1: Enter Final Value, Initial Investment and Years in Google Sheets.
- Open Google Sheets.
- Enter values of Final Value, Initial Investment and Years in Google Sheets.

Step 2: Enter the CAGR Formula
- Now, select a cell where you want to calculate the CAGR for your investment.
- Enter the following formula:
=(B1/B2)^(1/B3)-1

- You will see that the CAGR is shown in the cell selected.
Calculate CAGR in Google Sheets Using the RRI Function
Syntax
=RRI(number of periods, starting value, ending value)
Here,
- The number of periods should be mentioned in years. If your period is 26 months, enter (26/12).
- Starting value parameter asks for the initial investment value.
- The ending value parameter asks for the final value after interest.
Step 1: Enter Final Value, Initial Investment and Years in Google Sheets.
- Open Google Sheets.
- Enter values of Final Value, Initial Investment and Years in Google Sheets.
Step 2: Use RRI Formula
- Now, select a cell where you want to calculate the CAGR for your investment.
- Enter the following formula:
=RRI(7, 8000, 20000)

- You will see that the CAGR is shown in the cell selected.
Conclusion
CAGR in Google Sheets is a handy tool for comparing the performance of various investments over time. You can calculate the CAGR in Google Sheets using the traditional mathematical formula approach or the RRI function.
See Also
Want to know more formulas and functions in Google Sheets? Look at our definitive guide on Google Sheets which covers hundreds of such topics here. Enjoy reading!
Create A Select All Checkbox in Google Sheets: Learn how to create a select all checkbox and its variations in Google Sheets.
How to create a Funnel Chart in Google Sheets: Learn how to create funnel charts in Google Sheets.
How to Use the SORTN Function in Google Sheets: Learn how to use the SORTN function in Google Sheets.